
Atlas
One platform. One source of truth.
Atlas is where every inspection, finding and pound of planned spend lives. It turns drone capture into a portfolio you can manage, evidence you can defend, and a plan the board can sign.
01The problem with data
Data rich. Decision poor.
Most estates are drowning in data - condition surveys, photo libraries, thermal scans, PDFs, spreadsheets - and starved of decisions. The evidence exists; it is just unusable. Atlas turns what you already hold, and everything we capture, into one ranked, costed, evidence-linked record you can act on, without making your team do the work of understanding it.
What you hold today
Scattered across formats and inboxes. No single source of truth, no shared view of risk.
One Atlas record
- Every asset ranked on one risk scale
- Costed and time-phased for the board
- Mapped to the regulation behind it
- Every figure traceable to dated evidence
That is the difference between holding data and being able to defend a decision with it, whether you answer to a board on commercial yield or to a regulator on building safety.
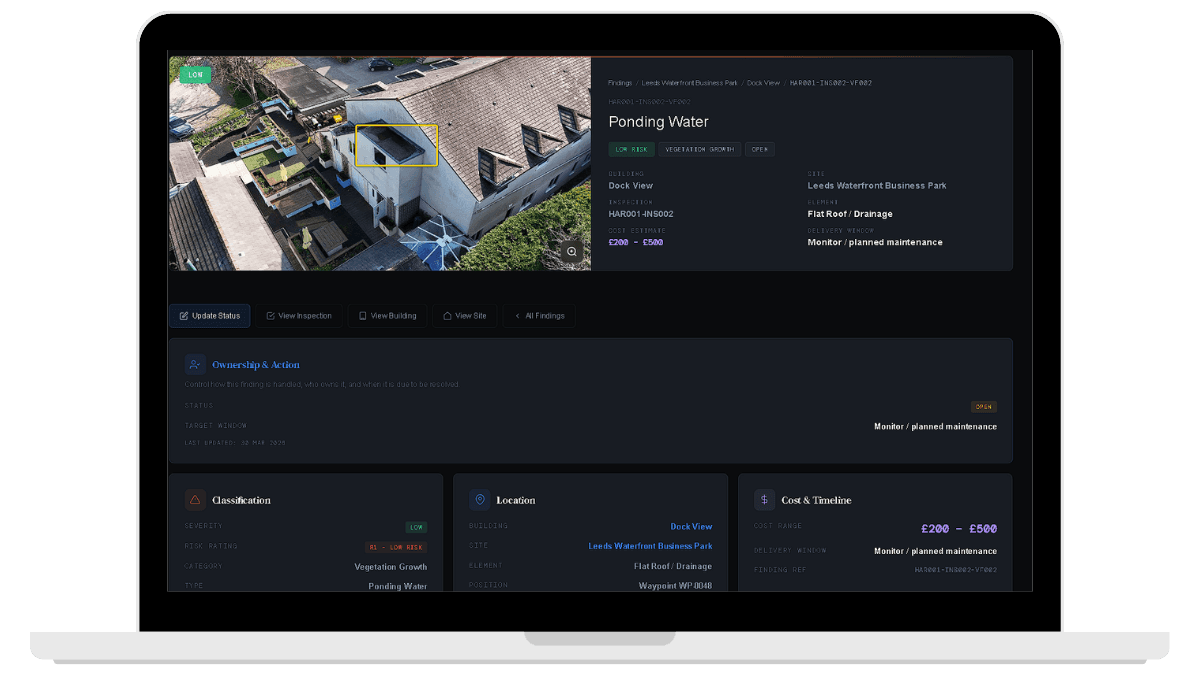
02One record
The same record, read four ways.
Asset & portfolio managers
The whole estate on one map, ranked by risk and by spend. Drill from portfolio to a single roof bay without leaving the screen.
Compliance & building safety
Dated, located, structured condition evidence ready for the Golden Thread, the safety case, or a regulator's request.
Finance & the board
A costed, time-phased CAPEX forecast. Worst risk first, deferrals justified, every figure traceable to a finding.
FM & delivery teams
Findings tracked from raised to resolved, with the imagery a contractor needs to scope and price the work.
03The risk register
Every finding graded, located and costed.
Sample rows, illustrative. The risk scale is consistent across every asset.
04Why it matters
Spreadsheets forget. Atlas remembers.
Condition data spread across PDFs and inboxes loses its value the moment an inspection ends. A system of record keeps it current, comparable and ready.
Comparable over time
Re-fly an asset and Atlas shows what changed since the last capture, so you can see a defect accelerating before it fails.
Consistent across assets
The same grading, the same method, the same report on every building. A 90-site portfolio reads like one inspection, not ninety.
Ready when asked
When a lender, insurer or regulator wants evidence, it is already structured, dated and located. No scramble.
Atlas, answered
It complements it. Atlas is the condition and evidence layer. Many clients export findings and CAPEX lines into their existing asset or finance systems, and keep Atlas as the source of the underlying evidence.
You do. The inspection data, imagery and findings on your estate are yours. Atlas is where you read and act on them.
It depends on asset age, exposure and risk. Many portfolios run an annual envelope capture with more frequent flights on higher-risk or post-incident assets. We will recommend a cycle for your estate.
Yes, with access you control. The point is one record everyone works from, rather than emailing PDFs around.
See your estate in Atlas.
We will fly one asset, return graded findings in Atlas, and walk you through what we found. No retainer to see it work.